Using maps in an application is pretty cool, as it allow to show data in a much more intuitive way. To do so there are great free tools, such as google maps… but, with its limitations, such as the ability to have maps offline, control it’s style, etc.
In my case I needed to have some necessary features such as:
- have maps based on OpenStreetMap data, as I needed to update certain areas that where outdated or lack details
- being able to use and display that data offline
- being able to edit and display features like areas, or POIs
- print maps
The ability to style maps, and the fact that is a web based technology came as a nice extra (even if, in the end styling came to be necessary, as I will explain later).
So where to find such an amazing tool?
Well, the solution, for me, wasn’t that easy.
Mapbox
I found out that there are some alternatives to Google Maps (you can read another article I wrote about it here), and one of the more compelling to me is MapBox, as it is already quite famous, open source, and with tons of features.
When I first discovered MapBox I was pretty sure it would work, so I started to develop the proof of concept application, set up a style I liked, and also added some POI, but all of it was Online. And when I came to the point where I needed to have that data offline, well I found some problems.
After spending days investigating the solutions I encountered on google, like having the mapping server working locally, or using alternatives such as Tangram. I realized that there was another possibility…
Map Styling
Another great feature of MapBox is that you can style every single aspect of your maps, you can add for example elevation, personalized icons for POIs, streets can change in size and color depending on the parameters you want, you can even add 3D buildings!
All the styling is stored in a file (well, actually, folder), in json format.
{
    "version": 8,
    "name": "Basic",
    "metadata":
    {
        "mapbox:autocomposite": true,
        "mapbox:type": "template"
    },
    "sources":
    {
        "mapbox":
        {
            "url": "mapbox://mapbox.mapbox-streets-v7",
            "type": "vector"
        }
    },
As you can see from the extract of a custom style file, the map source is also defined here.
And I thought that I could just point that to openstreetmap.org to have offline maps, huh! WRONG! You can’t.
So what was the solution?
GeoJson to the rescue
Mapbox allow to use overlay data in the form of GeoJson data (GeoJSON is a format for encoding a variety of geographic data structures), as locally stored files. Pretty cool!… But MapBox does use it only as a way to represent your data, such as demographic, pois, areas, etc. Overlays to an existing online (or cached) map.
Well, as I described above, the style allow to define pretty much everything of the rendered map, included the overlay GeoJSON file, and that led me to try use GeoJSON overlay as the actual map.
What made me think it was a real possibility is the great tool that allow to convert OSM files (the OpenStreetMap standard) into GeoJSON files. You can see the author’s project here. So, thank you Martin Raifer for your great converter.
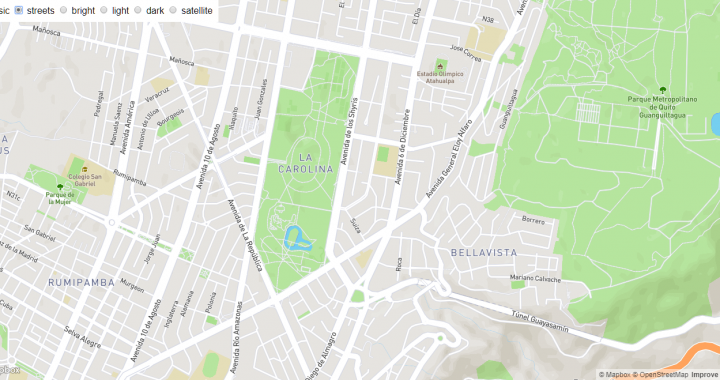
Once I had the converted GeoJSON map I started styling it, so that it was able to represent every feature of a normal map.
Once I had all the main elements of a map (streets, rivers, areas, labels, etc.) I felt comfortable enough to say that it is possible to represent maps offline using MapBox.
The App
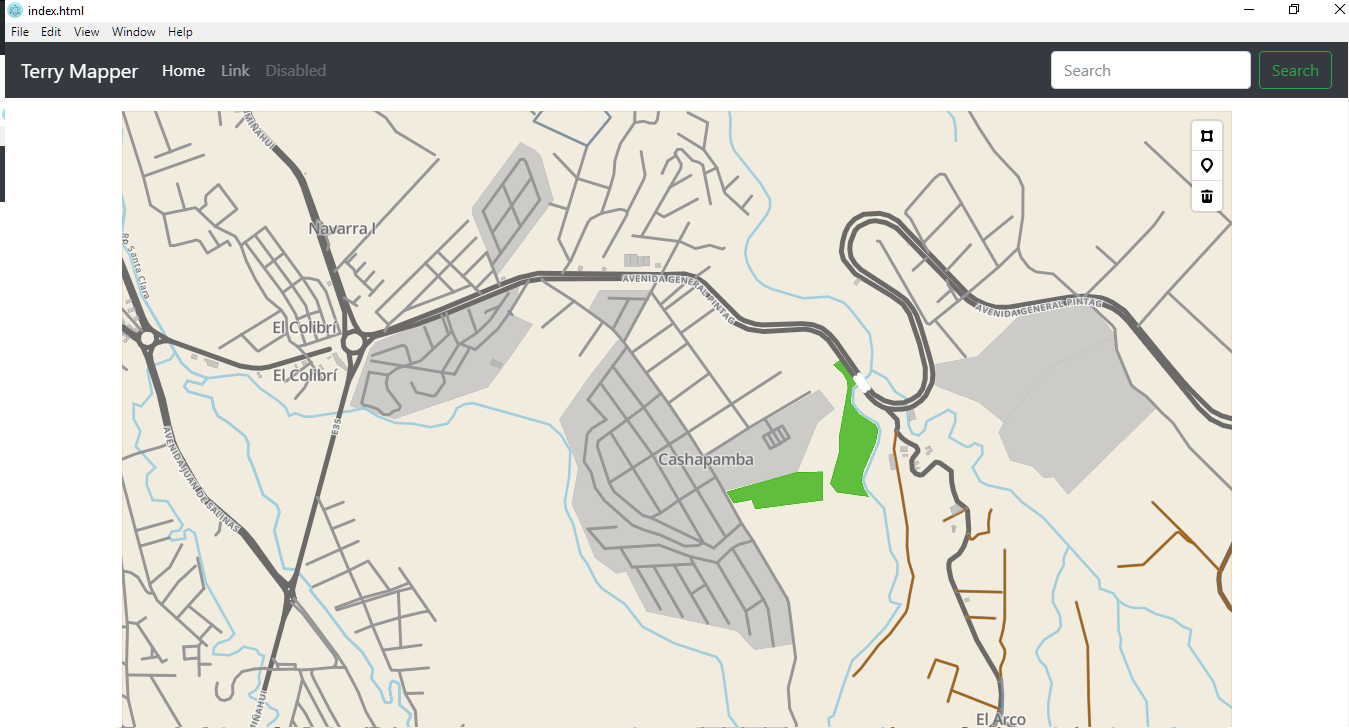
A screenshot of the application’s interface
One thing that I haven’t mentioned so far is that Mapbox GL JS is a JavaScript library, so it can be embedded into HTML pages, or, as I did, it can be used within an Electron application.
And that’s what I did, I created an Electron app that could run it all as a desktop application.
I slowly, but without any particular issue, managed to include all the functionalities that I needed.
Offline map rendering
As I mentioned before, the converter that I used allowed me to transform OSM files into GeoJson, so I coded the application in order to convert automatically every OSM file I drop in a specific folder. Once converted, the code uses it as a source for the map. I still haven’t tried but I think it is possible to include several maps and have the application represent all of them in the same control.
Map Overlays
Another feature that I needed was the ability to add/edit overlays, areas and points (or POI – Point Of Interest). Mapbox have a plugin that allowed me to do so, MapBox GL Draw, pretty cool stuff, and quite easy to integrate.
Once integrated I had 3 nice little buttons that allow me to add or remove areas and points (edit is done by just clicking at the object and then actually dragging the objects).
Printing
I first thought to integrate an SVG export, and use that SVG to print maps, but I found out a couple of issues, one of them was that SVG is not supported by many applications, so in order to render and print it it’s not easy.
So second thought was to use Electron’s printing functionality, much better solution in the end, as it allows me also to export the page as a PDF (and when you do so, text is rendered as text, not as a whole big image).
Future
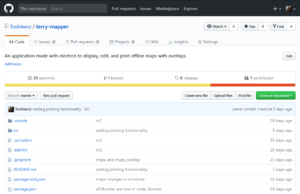
The repository of the demo App on GitHub
Next steps of this project will be to have the actual Application, not only a demo.
I will most likely include:
- An interface with tabs
- tab for area view/edit (1 for each overlay file)
- tab for area overview (a global map showing all areas)
- printing button on each view tab
- tab for basic style editor, allowing to live modify how the map is represented
- tab for OpenStreetMap OSM file download
You can follow progress or even join development on my repo.
Several other things are possible using MapBox with this approach, and I will continue write articles on the subject, stay tuned.